


Historical data
Often I come across articles on the web that, based on the analysis of a series of historical data, argue some more or less likely theory. Typically they focus on the identification of specific trends or periodicity within a chart that shows some data within a specified time frame.
Charts of this type are used in all disciplines. For example, in economics or finance, in the analysis of the climate or catastrophic events such as eruptions, earthquakes or mass extinctions, or even simply to analyze the sales of a certain product or tourist flows towards a particular territory.
Once reported on the chart, data can often show so clear trends or occurrences that it is natural to build on some theory that explains them. However, making an analysis of historical data is actually much more complex than one might believe and it is not unusual that certain trends or periodicity have very different causes from those assumed.
A first cause concerns the acquisition of the data itself. Given that we are talking about historical data, that is, data taken at different times, its reliability is not constant over time as well as the procedures, the frequencies, and the acquisition tools are not the same. It is quite reasonable to assume, for example, that time passing the instruments become more accurate, the acquisition frequency and coverage of the territory are greater, the expertise of researchers and of those who carry out measures improves.
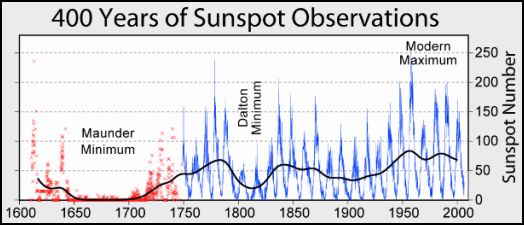
Let us consider, for example, the sunspot cycles. There are valid historical data ongoing since 1750, but already in 1600 there are still records that are sufficiently reliable though not with the same frequency as that in later centuries. It follows that some periods of minimal, such as the Maunder’s from 1645 to 1715 and the Dalton’s from 1790 to 1830, be very reliable events, that is, really happened. If we go further back, however, we have many observations but not with the same frequency and reliability, so any minimum may not correspond to actual historical events, but only to a lack of data.
A second cause concerns the very definition of data, or rather, the metrics associated with that data. Think for example the so-called “market basket”, that is, the set of goods and services that represents the actual consumption of households in a given year. It is a variable set and then can be very complex to compare the data related to a decade than those related to another decade. This does not mean that we can do no analysis with this kind of data, but only that we must be very careful in stating that there are specific trends or events.
The third problem concerns the contextualization. Often data is influenced by multiple causes and in various historical periods some of these causes can prevail over others. This means that certain minimum or maximum as well as increases or decreases may not be comparable and thus the trends and occurrences which may result in the chart may not be linked by any common cause, but simply be the result of completely different events.
Let us consider, for example, mass extinctions. Some are related to events which may actually have a certain periodicity, such as the explosion of calderas and supervolcanoes, others are related to completely random events as the impact of an asteroid or the emission of X-rays from a distant supernova. By analyzing the last 542 million years, there seems to be a periodicity in extinctions of 27 million years, but it is rather difficult to say whether this is a real occurrence or is rather the result of a different periodicity supplemented by a series of unique and random events.
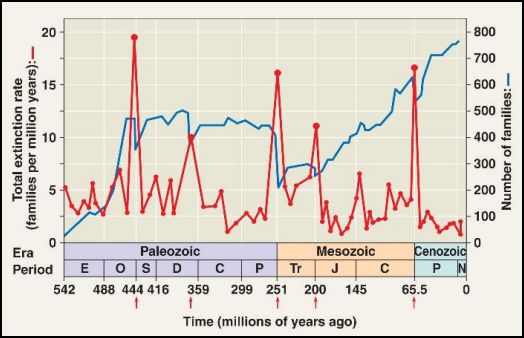
There is also to consider the fact that we do not know exactly how many species went extinct at various times, but at most we can analyze the density of fossils of marine species. Given that not all species have generated fossils and we do not know the ratio between the number of marine species and non-marine species at various times, the data is not necessarily representative of the actual percentage extinction rate. On the other hand, however, that data has its own validity and allow us to try to develop reasonable hypotheses, as long as we contextualize data by considering also other facts and measurements.
That said, there are sometimes representations of historical data in which the full decontextualization assumes significance. An example is the historical map of the 2053 nuclear explosions which have taken place between 1945 and 1998. This map, created by Japanese artist Isao Hashimoto, does not enter into the merits of which historical contingencies have led some countries to increase or decrease the number of tests of nuclear weapons on our planet, but merely show dates, places, intensity, and frequency in the aforesaid time frame.
It is clear that this kind of map is not a valid tool for historical analysis of geopolitics as far as the development of nuclear weapons in the last fifty years is concerned, but it gives a very clear idea of how much and when some countries have invested in this area. At the end, as far as one can be conscious of the logic, right or wrong, that led those countries to conduct the tests in question, watching this interesting animation leaves a bitter taste in mouth at the thought of how much humanity invested in a research that more than once has endangered our world and that, from the outside, looks really foolish.
In conclusion, although it is not correct, in principle, to graph a series of historical data without any contextualization or accurate analysis not only of the causes, but also of the mode of acquisition of the same data in the course of time, there are sometimes some visual representations of data which, thanks to a decontextualization that removes any potential explanation or justification, provide with a strong message that, otherwise lost in a detailed analysis, could be missed.

Please use Facebook only for brief comments.
For longer comments you should use the text area at the bottom of the page.
Facebook Comments